
Campaign Analytics


Professional Leader Magazine Advertising
Understand how campaign performance is measured against defined engagement events rather than surface-level traffic. Learn how Professional Leader Magazine flipbook views, PDF downloads, transcript views, and layout interactions are recorded as verified reads. Review our tracking structure, UTM tagging, and conversion definitions that underpin consistent reporting. Discover how channel attribution, device data, and cohort analysis provide clear insights into performance measurement and the factors influencing your advert’s success.
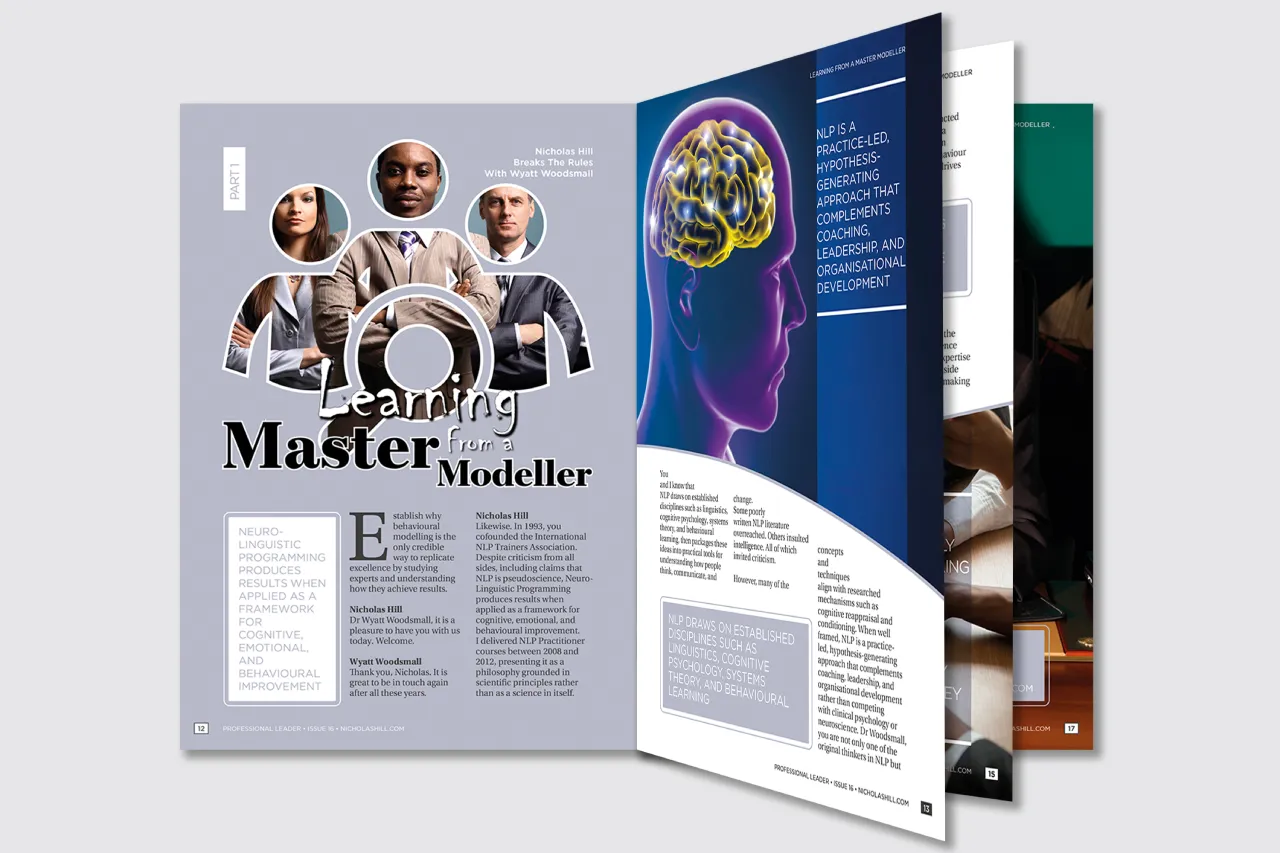
Pictured: Selected client ads published in Professional Leader Magazine.

Trusted by Leading Organizations






































































Current Advertising Partners
Featured Brands
Exclusive Reader Offers
Learn More
FREE Bespoke Furniture Samples
Learn More
FREE Website Marketing Review
Learn More
GUARANTEED B2B Lead Generation
Learn More
ELEVATE Your Brand Design
Learn More
FREE Brand & Trademark Risk Review
Learn More
FREE Business Accounting Consultation
Learn More
SELL Your Spare Business Capacity
Learn More
FREE Business Growth Barrier Audit
Learn More
FREE Social Selling Success Audiobook
Learn More
FREE Business Financial Health Review
Learn More
FREE Protect Your Hearing Guide
Learn More
FREE Team Retreat Planning Checklist
Measuring Campaign Performance Via Engagement Metrics
Event Tracking and Read Definition
We use Google Analytics event tracking to define exactly what counts as a read of Professional Leader Magazine. Key interactions, such as opening the flipbook, downloading PDFs, reading published transcripts, or viewing single-page layouts or double-page spreads, are recorded as magazine reads. Our engagement tracking excludes bounces to prevent casual page views from distorting the data. Each recorded read indicates genuine engagement and serves as a reliable indicator of our active readers.
Conversion Events for Magazine Reads
Professional Leader Magazine reads are set up as primary conversions in Google Analytics, helping distinguish genuine engagement with our published issues from casual browsing of the Nicholas Hill Academy website. Each issue contains descriptors, including interviewee name and title, release season, and issue number, allowing us to monitor campaign performance for each release. Magazine reads are considered conversions, enabling consistent reporting across issues, channels, and performance trends.

UTM Source–Medium–Campaign Structure
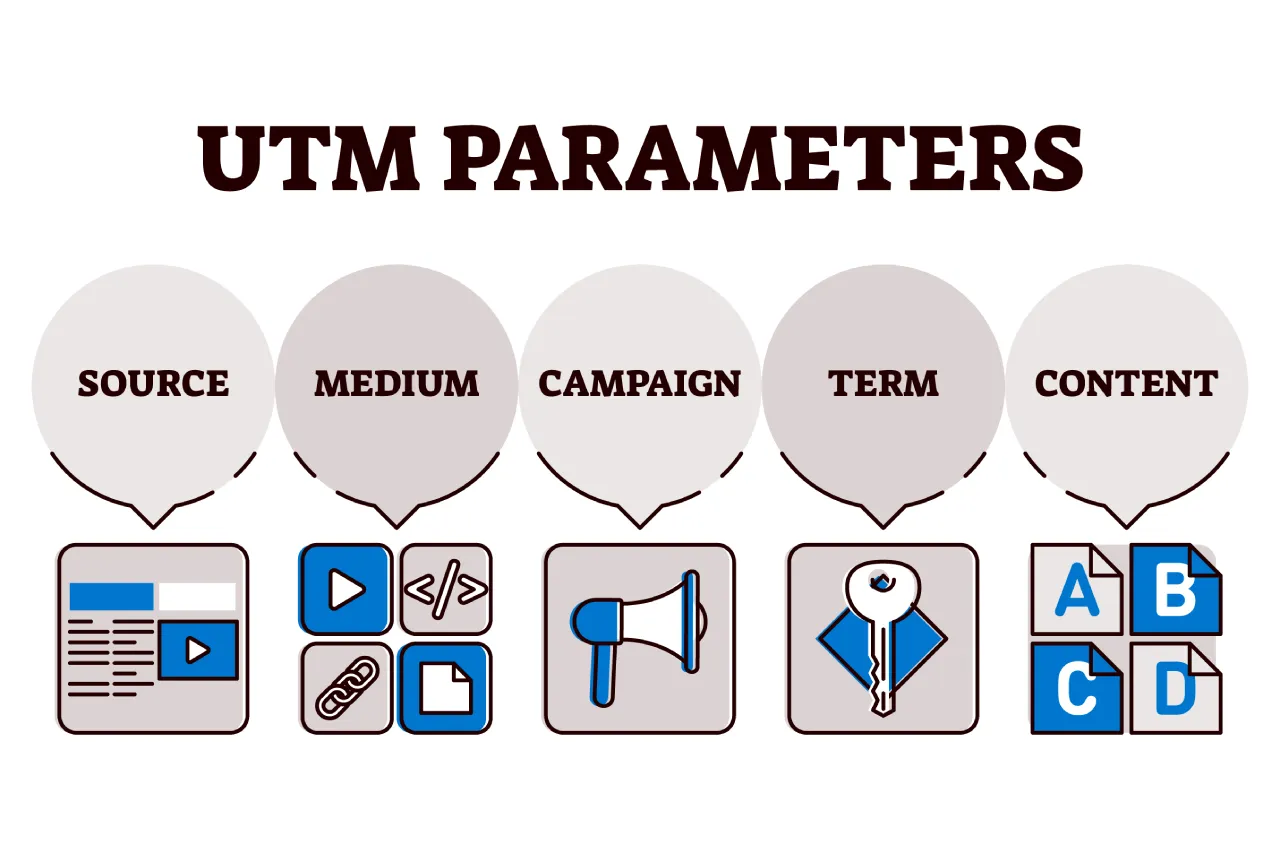
We use UTM (Urchin Tracking Module) parameters to monitor all external links to Professional Leader Magazine pages and apply a consistent naming convention. The campaign source indicates where traffic originates (eg, Google, client email, Issuu, joint venture, social media, targeted email campaigns). The campaign medium specifies the type used (such as display, email, referral, or cost-per-click). The campaign details include the issue number and wave (eg, “PLM Issue 25, Client Campaign 1”).
Traffic Acquisition Reporting by Channel
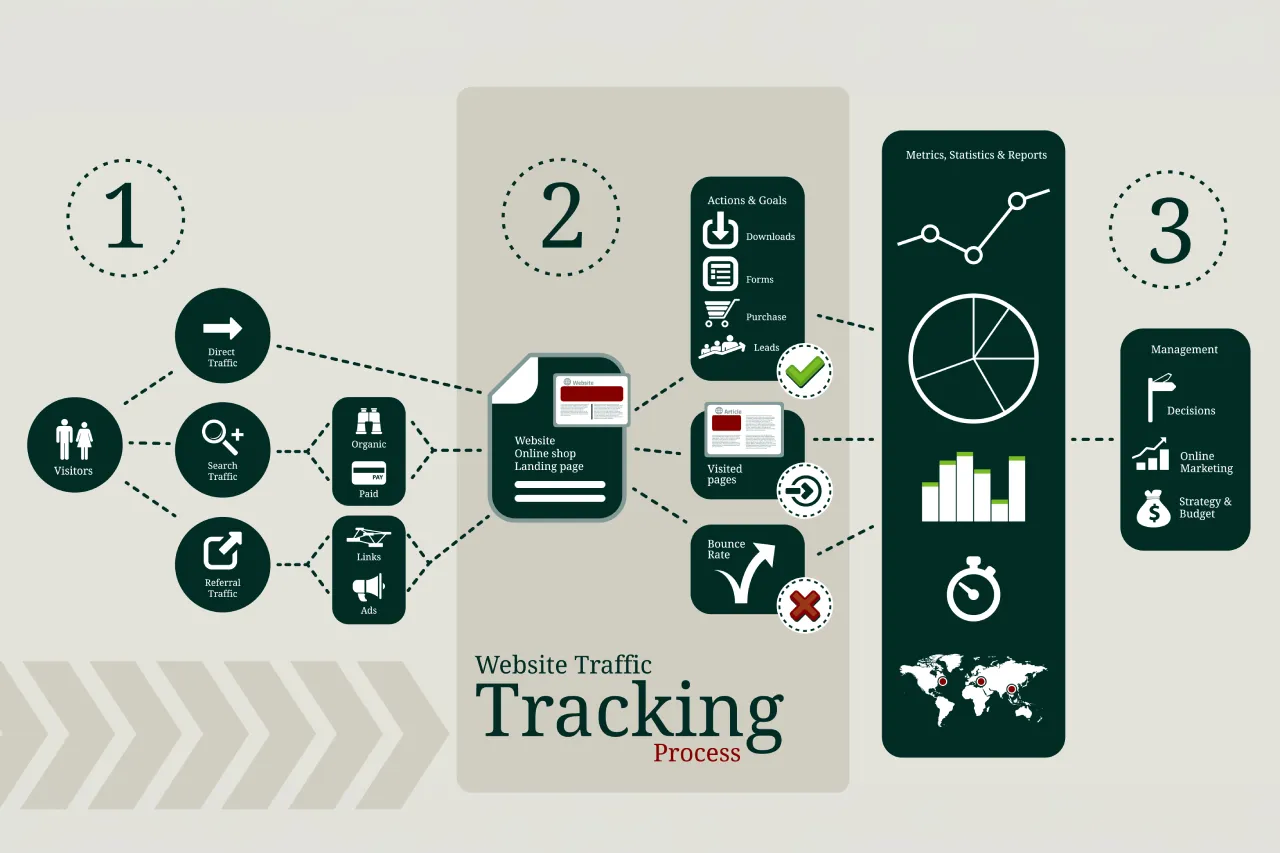
The Traffic Acquisition report in Google Analytics shows how each channel contributes to the number of active magazine readers. Professional Leader Magazine uses a UTM structure to analyse users, sessions, views, and conversions by source and medium. For most links we create, we assign a UTM tag to track them and monitor trends. Where possible, we do this for Google Ads, client campaigns, Issuu, joint ventures, social media, targeted email campaigns, and future channels.
Landing Pages and Flipbook Performance
We use Pages, Screens, and Landing Page reports to assess how well each magazine entry point performs. Pages for the flipbook, published transcripts, single-page layouts, and double-page spreads all use independent URLs and page titles that include the issue and feature name. For each landing page, we track engagement time and conversions. This data indicates whether readers prefer to start with the flipbook or with one of the other dedicated pages and helps us assess the effectiveness of each method.
Engagement Rate and Scroll Depth
Google Analytics engagement metrics show how readers interact with Professional Leader Magazine content. We monitor engagement rate, engaged sessions, and average engagement time for key pages, including flipbooks, interview transcripts, single-page layouts, and double-page spreads. Custom scroll events indicate how many transcripts and materials have been viewed. These additional metrics reveal readers’ activity and whether changes to layout, signposting, or links boost engagement.

Audience Segments and Reader Cohorts
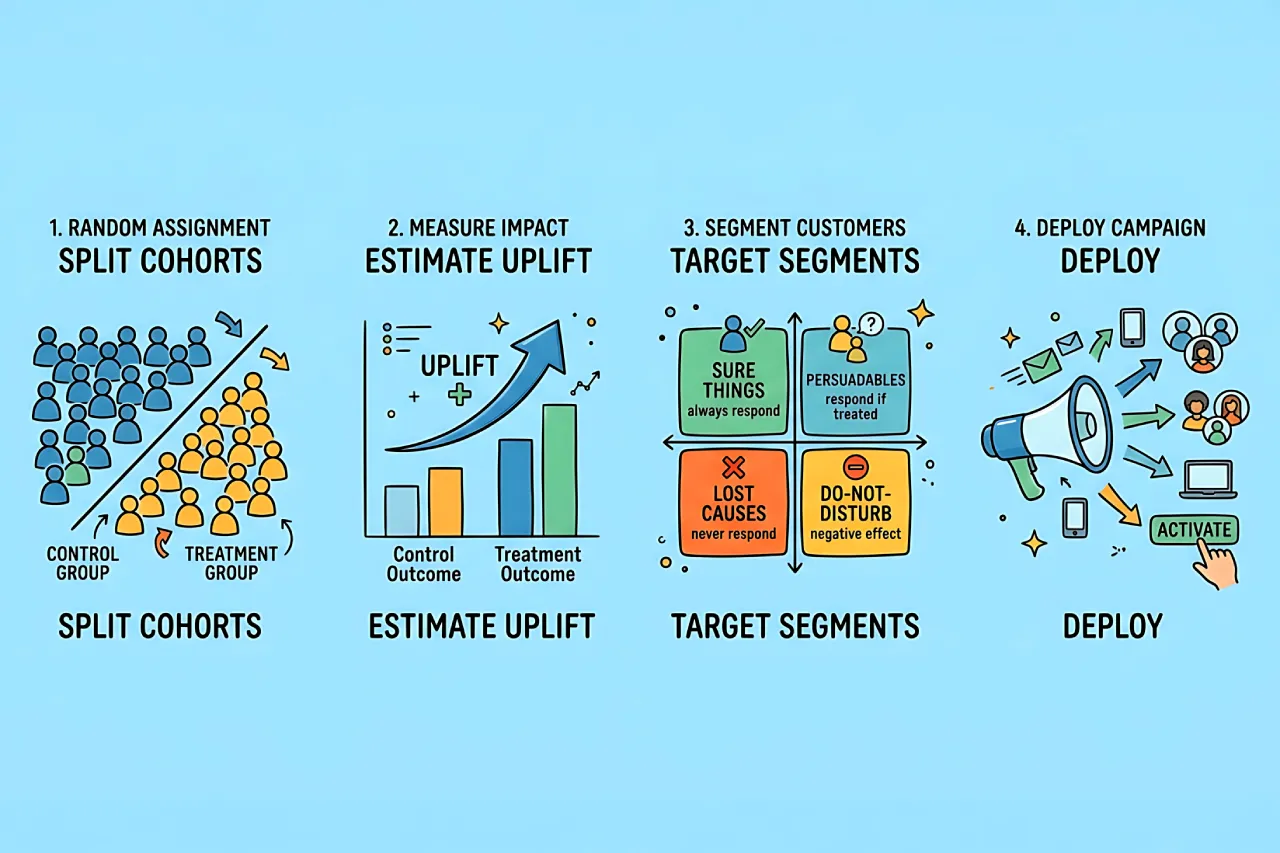
We define Google Analytics audiences and segments to analyse reader behaviour patterns for Professional Leader Magazine. We identify whether readers are new or returning, and whether they are clients or non-clients. We apply this approach across most channels to evaluate campaign performance. These segments are examined in our reports and dashboards. This segmentation assesses whether some cohorts view more pages, browse our back catalogue, or return for future editions.
Device Category and Platform Reporting
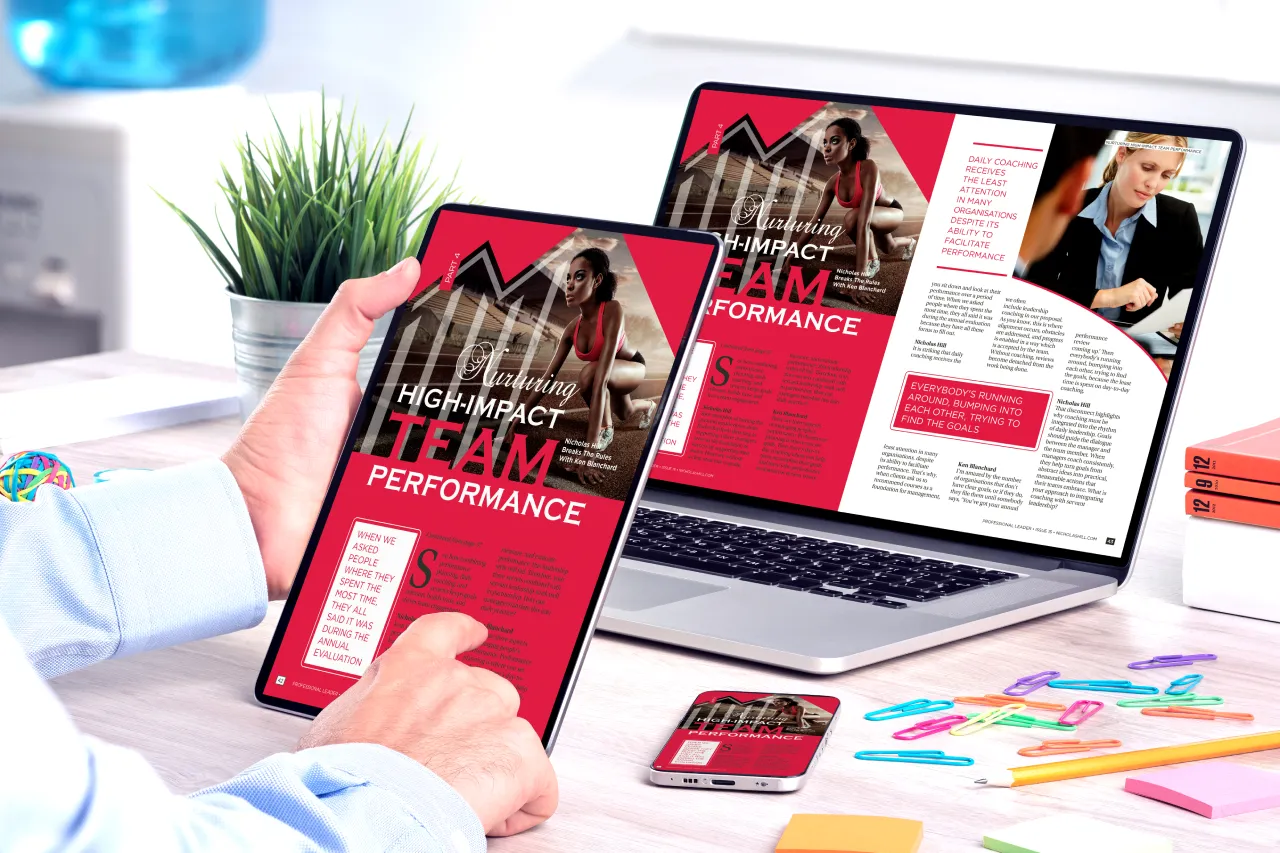
Google Analytics device and platform reports show how readers access Professional Leader Magazine on desktops, tablets, and mobile devices. We analyse views, engagement rate, engagement time, and conversions across devices. This verifies that digital layouts function correctly on all platforms and screen sizes. If some devices consistently show shorter sessions or lower conversion rates, we review our strategy. This method helps maintain an optimal reader experience across all devices.
Attribution and Assisted Conversions
Google Analytics attribution reports and the advertising workspace show how different channels collaborate to drive conversions for Professional Leader Magazine. We compare data-driven and last-click views to determine which channel achieves the final click and which ones stimulate interest early on. Assisted conversion data shows which campaigns influence reader behaviour. This analysis examines the contributions of each distribution method and assesses whether channel collaboration needs improvement.
Campaign Reports and Dashboards
Professional Leader Magazine uses structured and user-friendly campaign reports and dashboards. These combine essential Google Analytics metrics such as users, sessions, views, engagement rate, engagement time, and conversions, with breakdowns by channel, issue, and landing page. For each edition, we provide, where possible, the total number of active readers, reads by source and medium, and device distribution. This reporting provides clear and accurate performance analytics.